
FY2026-27 · State-Wise Commerce Sizing
India's Household Commerce Opportunity, Mapped State By State.
State-wise estimates of India's household retail demand - know the market, and the timing.
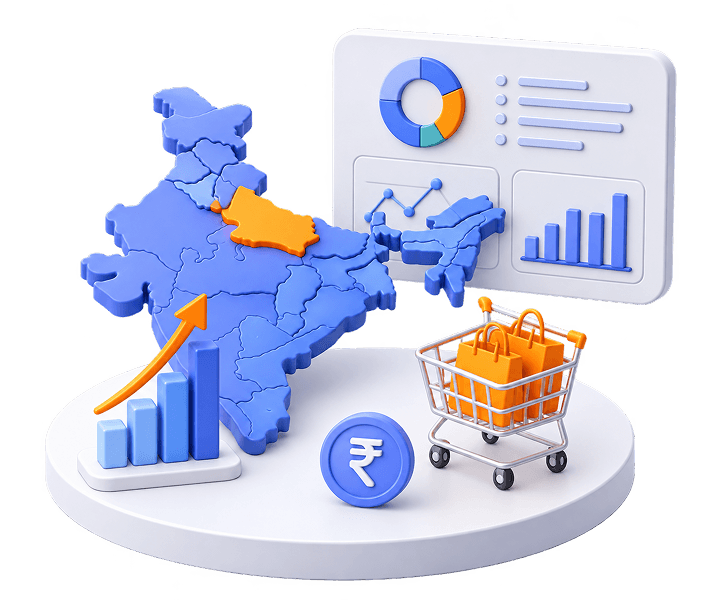
At a Glance
India's Consumer Spend, Simplified
A household-spend model focused on real consumer spending - not broader industry turnover.
India Consumer- Commerce Pool
₹116.64L Cr
Annual household spend, every state and UT.

Household Retail-Goods GMV
₹69.99L Cr
Average ₹5,83,225 cr per month.

Largest Single Opportunity
Uttar Pradesh
₹9,33,679 cr - 13.34% of India alone.

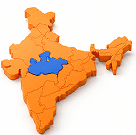
Madhya Pradesh retail GMV
₹3,55,002 Cr
India Ranks #9 of 36
State & Union Territory Ranking
Where India's Retail Spend Sits
The top 10 of 36 states and UTs account for 71.2% of India's total retail GMV.
| # | State / UT | Pop. (Cr) | Spend/Person (₹) | Annual GMV (₹ Cr) | Monthly GMV (₹ Cr) | Share | Online Low (₹ Cr) | Online High (₹ Cr) |
|---|---|---|---|---|---|---|---|---|
| 01 | Uttar Pradesh | 24.35 | ₹3,907 | ₹9,33,679 | ₹77,807 | 13.34% | ₹56,021 | ₹74,694 |
| 02 | Maharashtra | 12.96 | ₹5,600 | ₹7,12,265 | ₹59,355 | 10.18% | ₹42,736 | ₹56,981 |
| 03 | Tamil Nadu | 7.76 | ₹6,894 | ₹5,24,921 | ₹43,743 | 7.5% | ₹31,495 | ₹41,994 |
| 04 | Bihar | 13.29 | ₹3,829 | ₹4,99,294 | ₹41,608 | 7.13% | ₹29,958 | ₹39,944 |
| 05 | West Bengal | 10.06 | ₹4,307 | ₹4,25,377 | ₹35,448 | 6.08% | ₹25,523 | ₹34,030 |
| 06 | Karnataka | 6.91 | ₹6,130 | ₹4,15,588 | ₹34,632 | 5.94% | ₹24,935 | ₹33,247 |
| 07 | Rajasthan | 8.39 | ₹5,023 | ₹4,13,554 | ₹34,463 | 5.91% | ₹24,813 | ₹33,084 |
| 08 | Gujarat | 7.43 | ₹5,419 | ₹3,95,420 | ₹32,952 | 5.65% | ₹23,725 | ₹31,634 |
| 09 | Madhya Pradesh | 9 | ₹4,020 | ₹3,55,002 | ₹29,584 | 5.07% | ₹21,300 | ₹28,400 |
| 10 | Andhra Pradesh | 5.37 | ₹5,874 | ₹3,09,810 | ₹25,817 | 4.43% | ₹18,589 | ₹24,785 |
Regional & Seasonal Shape
Where And When Demand Happens
See how ₹69.99L Cr in retail spending is distributed across regions and changes throughout the year.
Retail GMV by region
Top 2 regions (North + South) contribute 55.9% of India's household retail demand.
Monthly retail GMV, national
Share of the annual total, by month.
October is the festive peak — ₹7,34,863 cr, ~40% above the Feb low.
State Commerce Opportunity Explorer
Pick A State, See Its Opportunity
All 28 states and 8 Union Territories, one consistent dashboard - annual market, monthly demand and SarchBazar revenue potential.
Month-wise retail opportunity
SarchBazar capture scenarios
(GMV, revenue at 2% take rate)At 0.10% capture, Madhya Pradesh represents roughly ₹355 Cr annual platform GMV and ₹7 Cr gross transaction revenue at a 2% take rate.
State market profile


SarchBazar Capture Economics
The Value Of Capturing The Market
See how SarchBazar's GMV and revenue grow as it captures 4 different shares of the ₹69.99L Cr market.
Stage 01
Pilot network
The starting point - a small, focused vendor and buyer base.
Stage 02
Early national scale
Live in more cities and building repeat usage.
Stage 03
National milestone
A recognized, major player in India's online commerce.
Stage 04
Scaled commerce network
A large, established network across most of the country.
Method & Confidence
How This Was Built, And Where It Could Be Wrong

Method, in short
- Covers all 28 states + 8 UTs, using 2023–24 rural/urban MPCE, 2026 projected population and 2011 Census residence mix.
- One national growth factor applied through FY2026–27; retail goods set at 60% of household spend.
- 2011 is the latest full Census, so fast-urbanising states may be understated - use this to prioritise, not as audited revenue.